
There was A LOT of hype with this last storm. Many forecasters, including myself, were on the high end for snow totals. Many of these forecasters have been receiving their fair share of disdain which is completely unwarranted. Let’s take a dive into what factors led to the much lower snow totals and get a better grasp on what went wrong.
When forecasting for weather events, forecasters will use data from the various models. We will use global models when the event is more than a few days out. These models are notorious for showing extremes. These models will give us a good idea of a general location and track. Once we get closer to the event we will switch to short range models such as the HRRR, NAM 3km, NAM 12km, etc. These models will give us a higher definition view of what may come. Once these models start agreeing with each other, our confidence level goes up. This storm showed variability between the models up until the morning of the event. Many of these models were showing a more northerly track which would have increased snowfall totals across the state. Due to this, I leaned towards more snow rather than less.
Now to the actual event. Convection along the southern portion of the storm (Dixie Alley) sapped moisture and energy from the more northern portions of the storm. This also pulled the low pressure system slightly south. Around midnight, snow began to fall in portions of South West Pennsylvania (SWPA). The storm itself had a west to east track instead of the *usual* south to north track. That track created that extremely sharp gradient in snow totals.

In this first image, you can see there is a very sharp line between no snow and heavy snow. This image is the last radar scan before midnight. You can clearly see a defined line where the drier air is keeping the snow away. Heavy, widespread snow has already been occurring south of I-70 for a couple hours.

This second image is from 1am on Monday. Heavy snow is still falling generally south of I-70. You can see that the sharp line has only slightly moved in the past hour. The dry air above Pittsburgh is still in place.
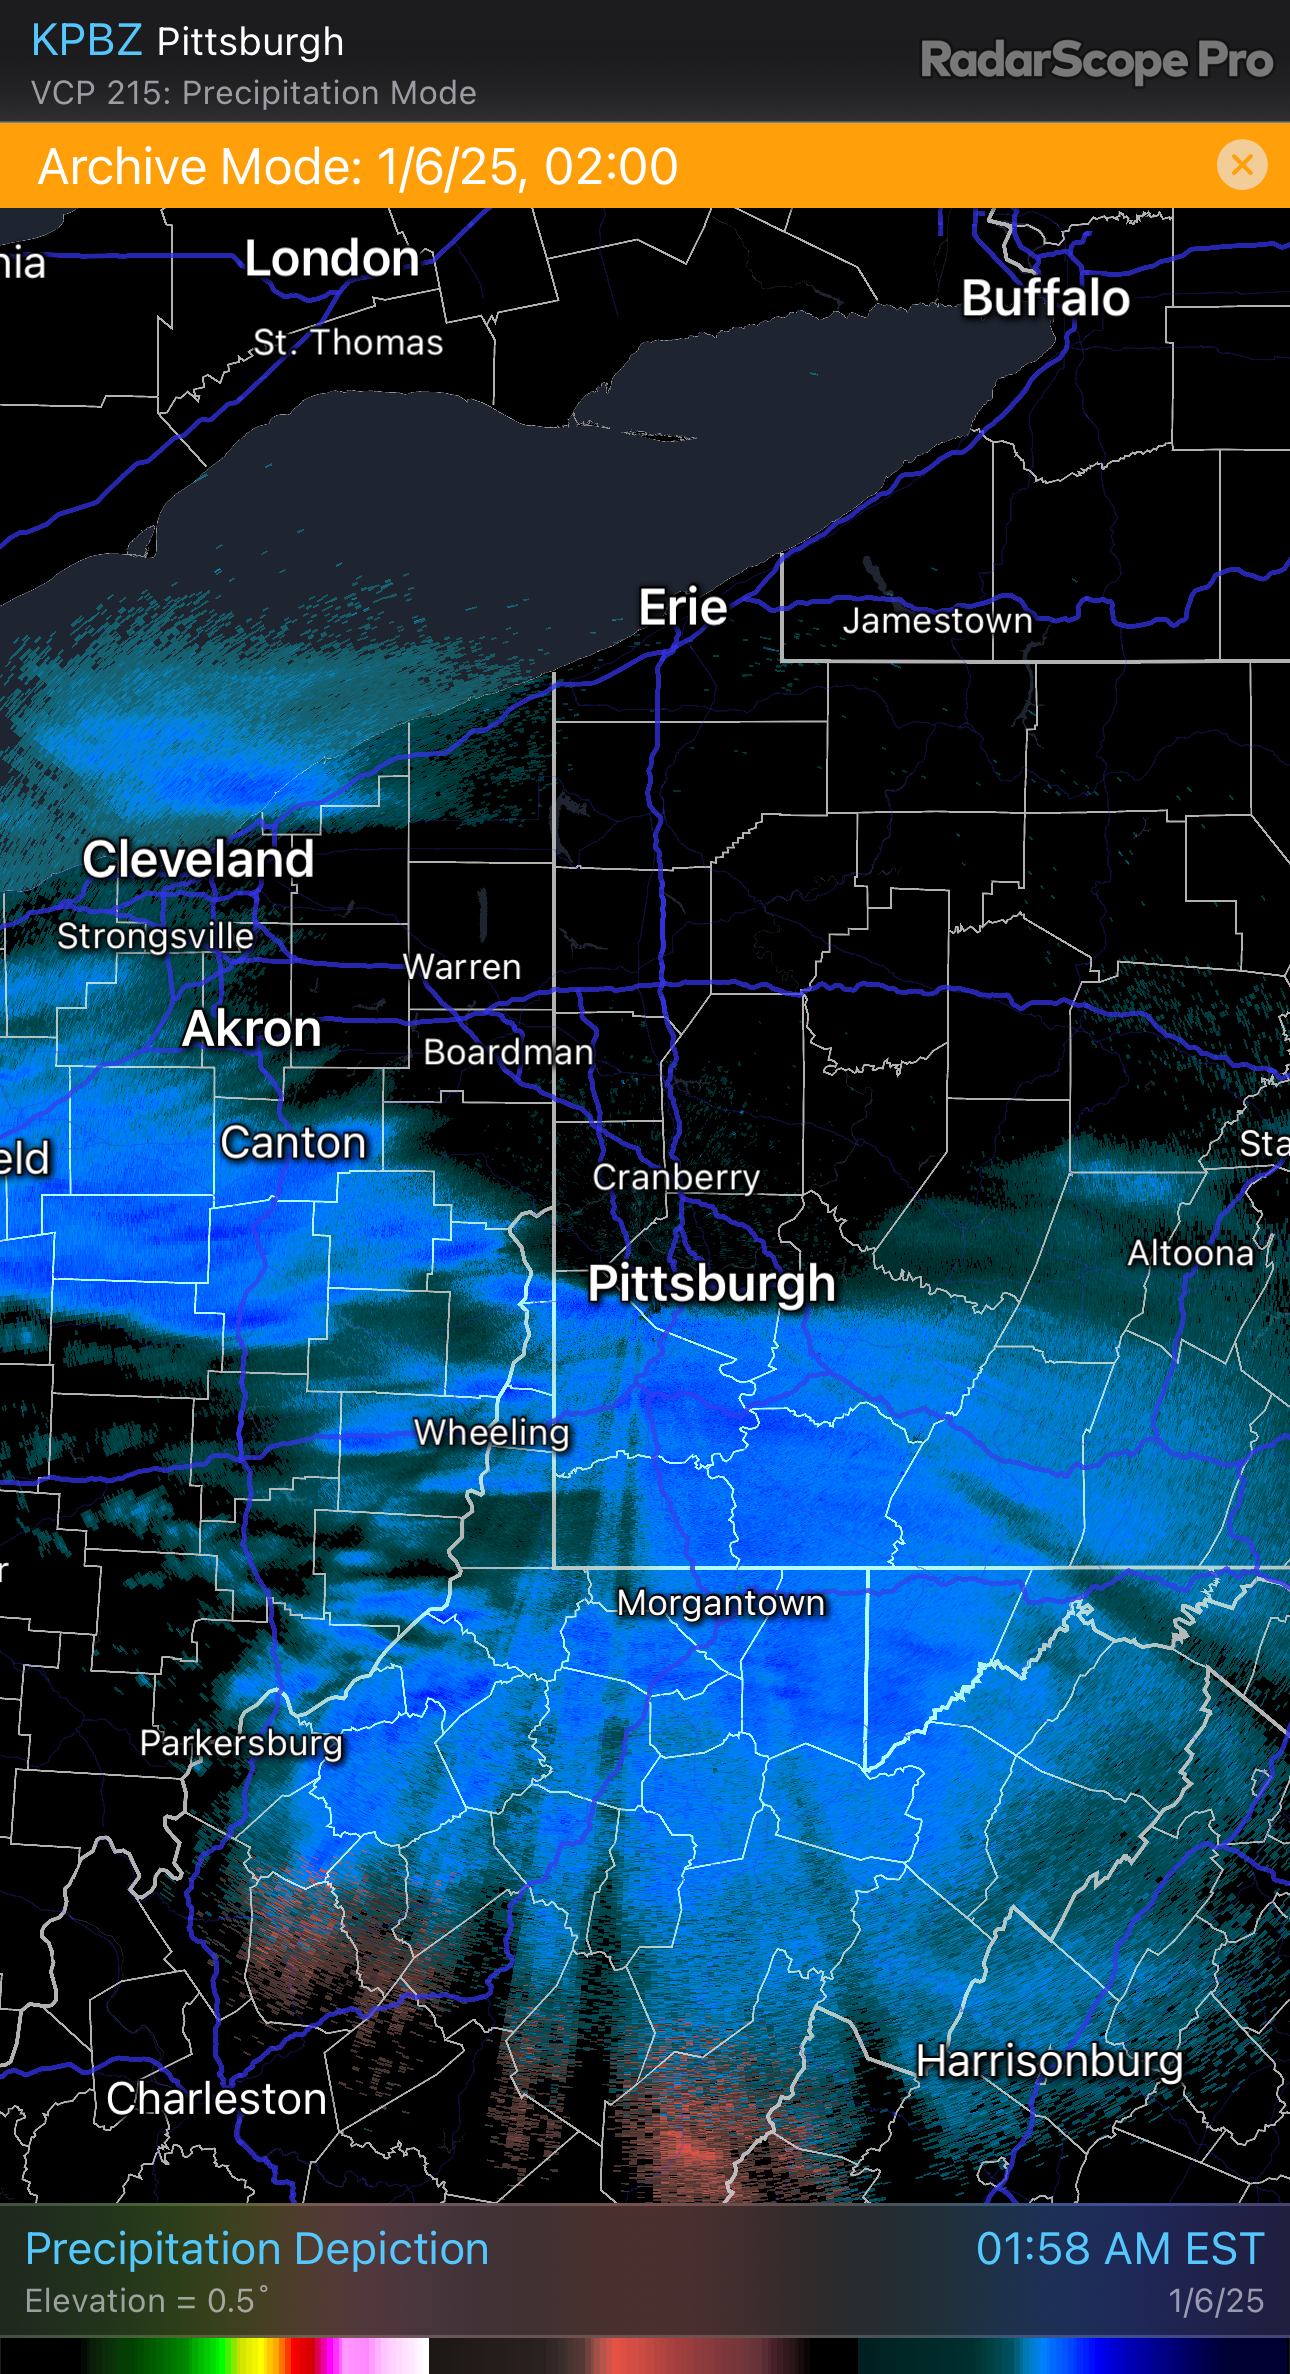
At 2am, the line still has only moved ever so slightly into the southern portions of the City of Pittsburgh. Again, that dry air is holding steady.

At 2:30, the dry air has finally been pushed out of the area. Light snow can be noted across the northern half of Allegheny County. These images depicted the storm movement over 2.5 hours. If the low pressure center was more north, that same sharp line would have been further north resulting in the predicted higher snow fall amounts.
From an amateur’s view, this storm was extremely hard to forecast for. It seemed like every hour the data was changing. That mixed with the lack of a blocking system up in Canada, it seemed to favor a more northerly track. We can use this event and look back and figure out the little details that could have helped us make a more accurate forecast! You live and your learn!
Leave a Reply